Cities are heating up in the same way a city budget can suddenly swell when unforeseen costs pop up. The urban heat island effect is not just a meteorology term to throw around in a climate lecture; it is a lived reality for millions who step outside and feel the heat, especially in streets paved with dark asphalt and surrounded by glassy towers. The paper discussed here tells a story about turning that heat into something readable, shareable, and actionable. It shows how a handheld infrared thermometer can transform a patch of a university courtyard into a living map of microclimates, and how students can read that map like detectives reading a citys weather diary. The project emerges from the Federal University of Maranhão in Brazil, specifically the Bacabal Science Center, with Welington Fabrico dos Santos Costa leading the work as the principal investigator. It is a reminder that science can be beautifully practical and surprisingly humane when it invites curious minds into the act of measuring the world.
What makes this study stand out is not just the measurement itself but the way it folds physics education into a real world problem. The researchers designed a hands on workshop during Brazil’s National Week of Science and Technology that put high school students at the center of the inquiry. They did not just learn about heat in the abstract; they gathered data, built a temperature map, and wrestled with the question of how urban design shapes the comfort and health of people who live in cities. The project marries the weather with the classroom, physics with policy, and curiosity with civic responsibility. That union is rare enough to feel urgent.
In fields like climate science, the narrative often centers on models and big numbers. This work zooms in to a street level, reminding us that cities are a mosaic of surfaces and shade. The authors and their collaborators ask a simple but powerful question: how does vegetation change the micro climate of urban spaces? The answer they uncover is not a single verdict but a pattern, a story that repeats across different surfaces and times of day. The core idea is straightforward: trees and other vegetation provide shade and drive moisture loss through evapotranspiration, cooling the air around them; concrete and asphalt, with low emissivity and high heat capacity, soak up sun and radiate it back as heat. The result is a map that makes the invisible visible, a color coded portrait of where heat concentrates and where relief comes from shade and greenery.
Beyond its scientific content, this work offers a window into how science can be practiced as a social activity. Students do not merely observe; they participate in all stages of knowledge construction. They pose questions, collect data, organize information, and justify their interpretations in a debate with peers and mentors. The study uses a qualitative quantitative hybrid approach to measure not only surface temperatures but also the growth of scientific literacy indicators such as information sequencing, data organization, and evidence based explanation. The paper is careful to show that the learners are not passive recipients but active producers of knowledge who can connect their everyday experiences with formal physics concepts. In other words, the project models a kind of enculturation into science that feels relevant, democratic, and empowering.
Urban heat islands meet green relief
The paper opens with a clear, almost tactile description of the phenomenon: urban surfaces soak up the sun, heat is trapped in narrow streets, and the air can feel heavy enough to press on the lungs. The researchers refer to the urban heat island effect as a climate fingerprint of cities, a local manifestation of a global warming trend. A key piece of the argument is that vegetation is not a mere decoration; it is a functional actor in the urban climate system. Trees, lawns, and other green patches alter the microclimate by shading surfaces and enabling evapotranspiration, which can cool the air and change wind patterns. In a sentence that lands with practical clarity, the authors point out that a city that trees out and greens up can literally lean toward cooler days and more comfortable nights.
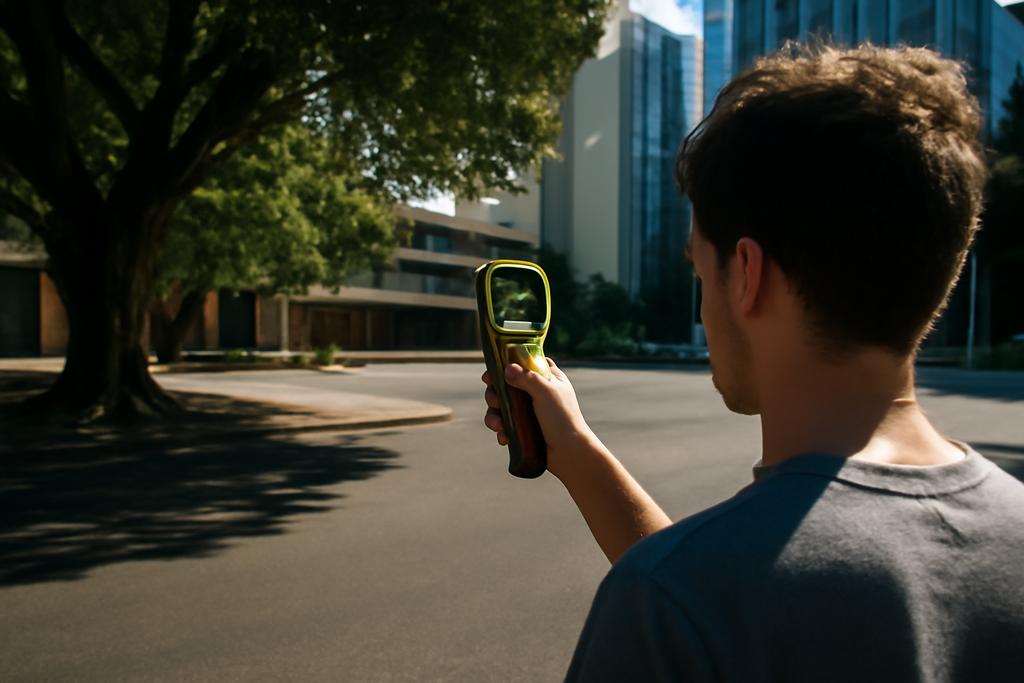
To study this dynamic, the team used a courtyard at UFMA Bacabal as a micro climate laboratory. The setting is not a sterile lab but an outdoor space with concrete paving, grass, and a few clusters of trees. Students mapped a 1800 square meter area by placing a grid of five square meter sections and recording temperatures at the vertices of the grid. Over three days and under different morning skies, they collected measurements with an infrared thermometer that reports surface temperature with a stated accuracy of about plus or minus 0.5 degrees Celsius. The surface types ranged from concrete and asphalt to grassy patches and tree shade. The basic idea was simple enough to carry in a backpack: measure, compare, and connect what you see with what you know about heat transfer and materials science.
The results were instructive and vivid. On days when the sun broke through, concrete surfaces in direct sun climbed into the low to mid forties Celsius, while shaded areas under trees stayed in the lower thirties or even cooler in pockets. One of the striking takeaways is how quickly temperature differences can arise in a relatively small degree of spatial change: a few steps from shade to sun can flip the reading by a few tens of degrees. The students did not stop at raw numbers. They produced color heat maps that turned the numbers into an intuitive image, with cool blues and greens marking cooler pockets and austere reds and oranges marking hotspots. The maps also included overlays of elements like trees, grass, and car lanes to help viewers connect the data to their surroundings. The act of mapping made the city legible in a way that numbers alone never could.
The article also highlights the social dimension of the activity. Groups of students collaborated with mentors who guided the process, ensuring that the data collection followed a consistent protocol. The careful design, including instructions to avoid measuring painted surfaces or areas in shade cast by bodies, reveals an attention to accuracy that helps students take ownership of the results. The resulting thermal maps were not ends in themselves but springboards for conversations about urban planning and everyday life in a hot climate. The visualizations gave students a tool to talk back to the city and imagine practical improvements, which is exactly the kind of citizen science the authors aim to promote.
One of the most compelling parts of the study is the way it uses the temperature maps to anchor discussions about vegetation and materials. Students repeatedly identified shade offered by trees as a major cooling factor, contrasted with the heat retention of concrete and sunlit pavement, and even started to articulate why this matters for thermal comfort and health. The authors connect these observations to broader literature, noting that a lack of green spaces and open areas correlates with higher local temperatures in many cities. While the study is contained to a campus courtyard, the logic extends to real cities, where thoughtful landscaping and material choices can reduce heat stress, especially for vulnerable populations.
Equally important is how the authors describe the development of scientific literacy indicators through the activity. The students demonstrated sequencing and organization of information, classifying data by surface type, and building explanations that link observed temperatures to surface characteristics. They practiced formulating and testing hypotheses and presented their reasoning with justification. The authors present this as evidence that investigative, problem based learning can nurture critical thinking and argumentation in a way that feels practical and relevant to students lives. The classroom, in this sense, expands into the city and the city, back into the classroom, creating a feedback loop between observation and interpretation.
The tool that makes heat legible
The core instrument in this investigation is a handheld infrared thermometer, a device that bridges the gap between a physical material and the sensation of heat. These thermometers sense infrared radiation emitted by surfaces and convert that energy into a temperature readout. The outcome depends on the emissivity of the material, a property that tells how effectively a surface emits thermal radiation. Materials with different emissivities heat and cool at different rates, so a given surface might look cooler than it is if its emissivity is low. The students learn that emissivity is not a fixed number but a property that changes with material, texture, temperature, and wavelength of detection. The instrument in their hands becomes a simple window into the physics of heat exchange.
Practical notes in the paper emphasize that the readings in this kind of field work are subject to a host of variables. Distance from the surface, angle of observation, and surface conditions all matter. Yet the team finds that with a disciplined protocol and multiple measurements, a reliable picture emerges. The classroom becomes a place where uncertainty is acknowledged and managed rather than avoided, turning a potential source of error into a learning opportunity about experimental design and data quality.
Beyond the device itself, the methodology of data collection matters as much as the data. The courtyard is divided into a grid and measurements are taken at the vertices, effectively turning a patch of outdoor space into a dataset. The grid coordinates provide spatial context, letting students link a high temperature reading to a concrete section or to a shaded patch. The use of a predefined measurement pattern helps students learn about sampling and representation while keeping the exercise accessible. The clarity of the approach is a lesson in itself: if you want to understand a city, you dont need a thousand sensors; you need a focused, well designed sampling plan that tells a coherent story about a place.
Once the data are collected, the students move to the next phase: turning numbers into pictures. They use open source software to create a two dimensional color map, a heat map that translates numbers into colors and places into patterns. To aid interpretation, the maps are layered with simple visual cues such as images of trees or cars to represent the landscape elements that might be driving the readings. This is more than a pretty picture; it is a cognitive tool that helps students connect the dots between material properties, microclimate, and urban design. The map becomes a shared reference for discussion and critique, a visual argument that can be used in future sessions with teachers, peers, or community members.
The educational payoff goes beyond the maps. The paper presents a detailed analysis of how students express scientific literacy through statements about the data. Students move from descriptive observations to more structured arguments, using evidence from the map to justify why shaded areas stay cooler or why concrete heats up more. They learn to organize information, classify observations, and test hypotheses in ways that resemble authentic scientific practice. The researchers even document moments when students connect the data to broader social questions, such as how urban heat can affect health and comfort, and how urban planning choices might mitigate those effects. This is not a narrow physics exercise; it is a template for connecting science to everyday life and civic action.
Lessons for classrooms and city planners
The implications of this work extend beyond the campus walls. The findings reinforce a simple yet powerful design principle for cities: shade and green matter as climate strategy. Vegetation and water features do not just beautify spaces; they actively reduce the local heat load, improve thermal comfort, and support public health. The study maps a clear line from micro scale decisions about paving materials and tree placement to macro level outcomes for urban climate and quality of life. In the real world, this translates into practical policy levers such as prioritizing tree canopies, selecting high emissivity or reflective paving materials, and designing street networks that encourage cooling through airflow. The authors situate their Brazil based study within a broader body of work that points to vegetation as a powerful moderator of urban heat, underscoring that well planned greenery is a climate adaptation measure rather than a cosmetic add on.
From an educational standpoint the project demonstrates the viability of science as a collaborative, student centered enterprise. The authors describe a flipped classroom sensibility where students take primary ownership of their investigations and teachers provide expert guidance rather than content delivery. The Bacabal experience illustrates how schools and universities can partner to produce learning environments that feel relevant and alive. Students become protagonists in a shared quest to understand how heat works in their own city and how it might be shaped for the better. The project also models an interdisciplinary approach that invites contributions from fields like environmental science, urban planning, and data visualization, suggesting a template for curricula that prepare students to think across boundaries in a climate shaped world.
Of course no study is without limits. The authors acknowledge that the focus on surface temperature during a short time window captures only a slice of the urban climate. Soil moisture, wind patterns, and seasonal changes are not addressed in depth here. Yet the consistent pattern across days and surfaces is suggestive enough to warrant expansion. The authors propose extending the approach to test different plant species or paving materials and to explore how these variables affect cooling under varying weather conditions. The core insight remains robust: by making heat legible through simple tools and participatory exploration, communities can make smarter decisions about how to design, rebuild, and inhabit urban spaces.
In a world where climate risk is increasingly felt at the neighborhood scale, the study provides a hopeful blueprint. It shows that a campus courtyard can become a laboratory for urban climate literacy, that students can translate data into credible proposals, and that science education can be a driver of civic imagination. The project is a reminder that the measure of a good scientific education is not how much theory one can recite, but how effectively one can connect theory to the places where people live and how those places could be made more livable for everyone. In that sense, the authors and their students are not just measuring heat; they are practicing a form of citizenship through science.
In closing, the work from UFMA and its partners invites a broader audience to participate in a simple yet profound activity: look at the heat around you, notice where shade helps, and imagine how a city could be greener, cooler, and more humane. The maps may be drawn with a classroom app and a pocket thermometer, but the ideas they carry are big enough to influence policy and everyday decisions. If more schools and cities adopt this approach, the future city could be a place where science, design, and daily life collaborate to keep us comfortable, healthy, and hopeful.