


The most powerful beams in science come with their own critics—their interactions with the world can ruin sensitive measurements. So researchers have long sought ways to study charged particle beams without tipping the scales. A recent experiment led by Rob Behary at William & Mary points the way toward a new kind of eye for electrons: an all optical, minimally invasive method that reads a beam’s electric field by watching how rubidium atoms dance in a cloud of laser light.
In the experiment, a stream of 20 keV electrons passes through a dilute rubidium vapor. The electrons generate an electric field that shifts the energy levels of highly excited, or Rydberg, states of the rubidium atoms. The team uses a quantum light technique called electromagnetically induced transparency, or EIT, to detect those tiny level shifts with exquisite sensitivity. By imaging how the rubidium fluoresces as the lasers scan through resonance, they reconstruct the field produced by the beam and from that reconstruct its width, its center, and its current.
The work comes from a collaboration that anchors William & Mary physics, with partnerships at Jefferson Lab and MITRE. It is part of a broad push to make beam diagnostics more robust, more precise, and less disruptive to the beam itself. If you can see the beam without touching it, you can measure more, faster, and with less risk of perturbing the very thing you are trying to study. An all optical, minimally invasive method like this could become a workhorse in facilities where every pass of a particle matters for experiments and machine tuning.
At the heart of the study is a move from entangled laboratory curiosities to practical measurement tools. Rydberg atoms are exceptional because their outer electron sits far from the nucleus, forming enormous electric dipoles that are exquisitely sensitive to electric fields. When those fields come from a passing electron beam, they shift the Rydberg energy levels in a way that can be read out with light. The researchers exploit a two photon ladder scheme, driving rubidium from its ground state up through an intermediate level to a chosen Rydberg state. The exact route is chosen to maximize sensitivity and minimize broadening, so the optical signal becomes a faithful map of the field around the beam.
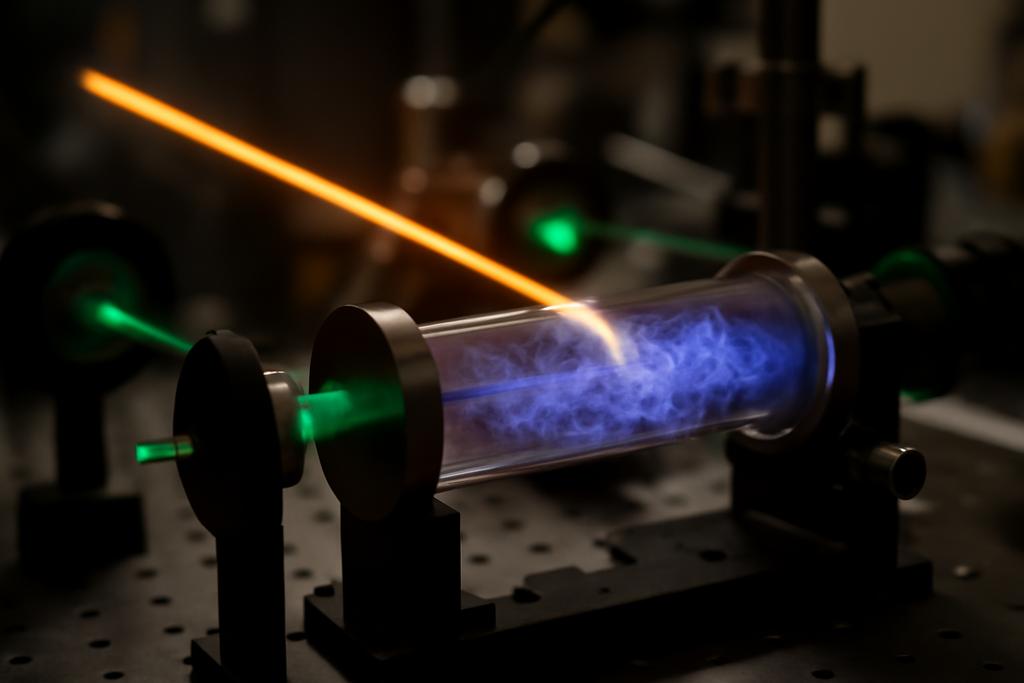
Viewed from a distance, the setup looks almost poetic: a pencil-thin beam of electrons crossing a warm cloud of rubidium where lasers glow like constellations in a fog. But the science is practical. The imaging system records fluorescence with a camera while the coupling laser sweeps across the Rydberg resonance, turning a field into a readable spectral fingerprint. In a sense, the field is a weather map, and the camera is a satellite that translates cloud patterns into temperatures and fronts. The result is a spatially resolved electric field map that encodes the beam’s position, width, and current with remarkable fidelity. Imaging the electric field as a proxy for the beam is what makes this approach both elegant and powerful.
A quantum eye on an electric beam
The trick is to turn a tiny electric field into a readable optical signal. Rubidium atoms in a vapor can be prepared in a quantum superposition of ground and Rydberg states. When the field from the passing electrons is present, each of the Rydberg sublevels experiences a shift in energy that depends on the square of the field, a Stark effect. The researchers exploit a two photon transition in which a probe laser at 780 nm and a blue coupling laser at 480 nm drive atoms from the ground state up to a Rydberg state such as 58D5/2. On two-photon resonance the intermediate state becomes transparent to the probe—a phenomenon known as electromagnetically induced transparency. The amount by which the optical resonance shifts maps directly to the local electric field produced by the beam. Turn a tiny field into a readable optical signal is not hyperbole here; it is the operational core of the method.
Because the beams are not perfectly uniform, the field inside the laser interaction region looks like two lobes where the field is strongest as the electron beam crosses the laser path. By imaging the fluorescence as the coupling laser frequency sweeps, the team obtains a spatial map of E that prints out as a heat map along the laser beam. The camera sees the Rydberg EIT signal change as the field varies, allowing them to infer the local E and thus the beam profile. A key advantage of this method is that the measurement is done entirely optically, with no physical intrusion into the beam itself. The Lorentzians and Stark maps aren’t mere abstractions—they are the translation rules between light and the electric field of a real beam.
To translate the measured field into beam properties, the scientists fit the observed field pattern to a simple Gaussian model of the beam. From this, they extract the beam width, the centroid position, and the current. They even verify the reconstruction by comparing with a second in situ signal: beam induced fluorescence of rubidium, which provides an independent cross check of where the beam sits inside the chamber. The agreement is striking, giving confidence that the optical readout is faithful to the beam’s real shape. The width comes in around a millimeter, and the centroid can be resolved to micrometer scale when the data are bunched and averaged. It is not just a pretty picture; it is a quantitative portrait of a beam passing through a delicate environment.
The experiment was performed with a 20 keV electron beam and currents ranging from near zero up to tens of microamps. The team also documented how the measured field changes as the beam slides across the chamber or as the current is varied. In these tests you can see the two-lobed field pattern tracking the beam’s center with surprising clarity. The reconstruction of current, though, is one of the more subtle outcomes: it tracks the general trend of the Faraday cup measurement but can differ by a factor if the beam is clipping somewhere upstream. That discrepancy is not a flaw so much as a signal that noninvasive optical diagnostics must be paired with careful beamline understanding to interpret every nuance of real hardware.
From light to numbers translating fields into beam properties
But numbers matter only if you know what you are measuring. The electron beam field is weak and curved, and parasitic charging in the chamber adds noise. The team thus calibrates their setup by scanning known fields and using a Stark map generated by an open source calculator for alkali Rydberg atoms to translate observed shifts into field strength. The math is not magic; it is a careful calibration dance that ties the optical signal to a physical quantity the accelerator folks care about: how strong the beam is, where it is, and how wide it spreads as it moves down the line. The calibration step is a reminder that even elegant quantum tricks need a human who can translate quantum whispers into engineering decisions. Calibration as the bridge between quantum signals and real world measurements.
In practice, they record hundreds of images as the coupling laser tunes across the Rydberg resonance, producing a pixelwise spectrum that reveals the local E at every point along the laser path. They then fit each spectrum with a model that sums contributions from the various magnetic sublevels of the Rydberg state, each shifted differently by E. The fit yields an electric field map, which they then fit again to a Gaussian beam model. With that, they report the width of the electron beam around 1 millimeter, a centroid position with micron level precision, and a current value that correlates with the independently measured Faraday cup current, though the latter tends to differ due to clipping upstream in the beamline. The line between laboratory technique and accelerator practice becomes a seamless thread rather than a chalkboard abstraction.
The result is not only a proof of concept but a demonstration of a practical diagnostic. The camera-based EIT readout can, in principle, provide a two dimensional picture of the beam, and with a light sheet geometry, even a cross sectional map. In other words, you could watch a beam sweep, shape, or kink as it travels through a detector, all without inserting wires or sensors into the beam path. That kind of noninvasive insight is a coveted tool at facilities where every pass of a particle matters for experiments and for machine tuning. The potential to go from a single thin slice to a multi dimensional reconstruction is the kind of leap that makes engineers dream of new diagnostic regimes.
Why this could change how we watch beams
The implications reach beyond this single demonstration. Noninvasive, optical beam diagnostics promise to cut down on perturbations that alter beam quality, while offering high spatial resolution that rivals or surpasses some traditional techniques. In high energy physics and accelerator science, where beams carry enormous energy and precision budgets, being able to peek at a beam’s shape without disturbing it is like watching a bird in flight with a camera mounted on a drone rather than chasing it with a net. The ability to capture two dimensional field maps opens doors to full twenty four hour monitoring of beam stability in ways that were simply not practical before. Noninvasive optical diagnostics as a new core capability.
There are caveats, of course. The chamber environment—background fields, stray charges, and the geometry of the beamline—can complicate interpretations. The current setup can only measure the absolute value of the field, not its direction, which means some information about the vector orientation of the beam’s field is lost. The team discusses plans to refine the chamber and the detection scheme to suppress parasitic charging and to push toward three dimensional mapping. A faster camera or a different sheet geometry could accelerate the frame rate from tens of milliseconds to kilohertz, enabling real time tracking on a meaningful timescale for beam operations. The practical path forward will likely involve iterative improvements to both the vapor cell design and the optical geometry so that the technique scales with the size and energy of future accelerators.
Still, the core idea is powerful: a quantum window into a classical instrument. The study conducted at William & Mary, with the Jefferson Lab and MITRE collaborators, shows that a cloud of rubidium atoms can serve as a quiet, sensitive proxy for the fields that charged particles generate. If the approach scales to different energies and to full three dimensional reconstructions, it could become a staple in the toolbox of accelerator diagnostics, plasma studies, and perhaps even beam based imaging in other contexts. The lead author Rob Behary and his colleagues have opened a path toward a future where lasers and ultracold atoms quietly watch over beams, while engineers tune machines with less risk of nudging the very phenomena they seek to measure.


