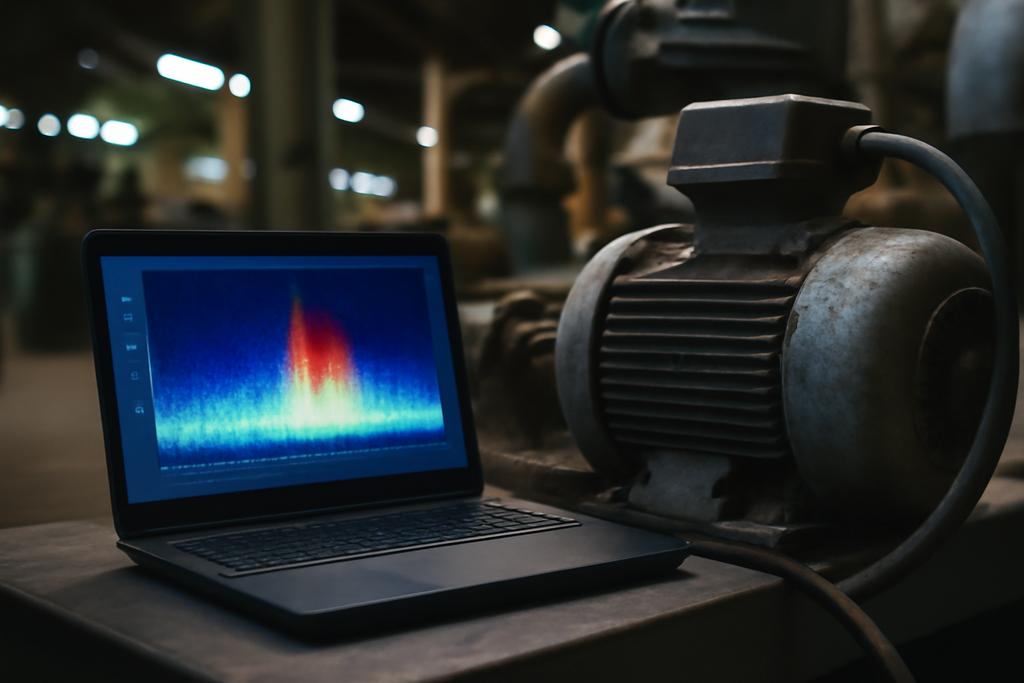
On a noisy factory floor, a machine’s heartbeat can reveal looming trouble long before a bolt squeals. Engineers have long used spectrograms—visuals that turn sound into a weather map of frequencies over time—to listen in on that heartbeat. But turning a spectrogram into a trustworthy alarm has always been part science, part art. The study from the Artificial Intelligence Lab at ZF Friedrichshafen AG in Saarbrücken, with collaborators at TU Dortmund University and the UA Ruhr Research Center for Trustworthy Data Science and Security, tries to give that alarm a transparent, statistical heartbeat. Led by Nicolas Thewes and colleagues, the work asks: can we detect anomalous sounds not by chasing fancy neural nets, but by reading the spectrogram with simple, explainable statistics?
What if anomaly detection could be explained as a kind of prime-number audit of every pixel in a spectrogram, rather than a black-box neural verdict? The authors propose exactly that: build a reference spectrogram from normal data by looking at each time-frequency cell, pick a high enough quantile to capture normal variation, and then flag deviations that stand out in a way that humans can trace back to specific moments in the sound. It’s a setup that sounds almost old-fashioned, except for the twist: the math behind it gives you a natural, human-readable explanation for why a test sound gets flagged. In a world where AI often feels like a mystery machine, this approach is a reminder that sometimes the most trustworthy answers come from well-chosen statistics rather than the latest neural architecture.


