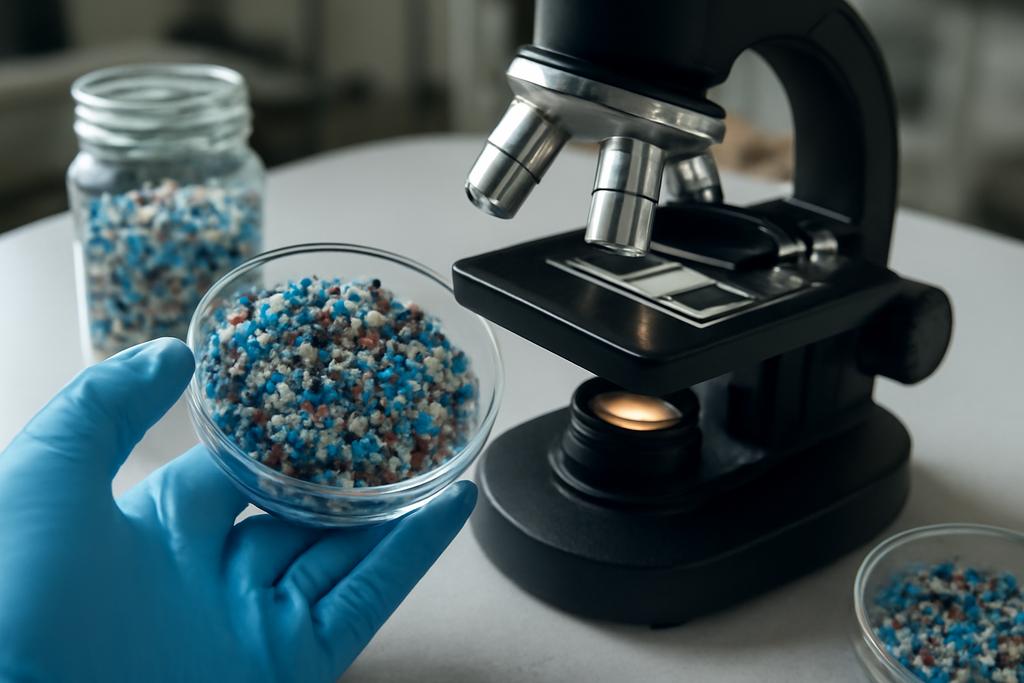
Microplastics are no longer just a fringe environmental worry; they’re everywhere, weaving through oceans, soils, and even the air we breathe. For scientists, the practical challenge isn’t simply finding plastic fragments but counting, identifying, and making sense of thousands of particles in a single sample. Traditional spectroscopy technologies—Raman and FTIR—can identify each piece, but when you’re staring down tens of thousands of particles, the math stops being elegant and starts feeling Sisyphean. That is precisely where a team from the University of A Coruña steps in with a clever twist on speed, accuracy, and patience.
The study, led by Adrián López-Rosales with colleagues José M. Andrade, Borja Ferreiro, and Soledad Muniategui-Lorenzo, emerges from the Group of Applied Analytical Chemistry at the Institute of Environmental Sciences (IUMA) in A Coruña, Spain. They worked with a high-speed infrared imaging system based on quantum-cascade lasers (the 8700 LDIR, commercially known as laser direct infrared imaging), capable of scanning thousands of particles in a day. The twist isn’t a new detector; it’s a smarter way to choose where to look so you don’t have to look everywhere at once. In short, they devised a sample-based subsampling strategy that adapts to each sample’s real pattern of particles, then uses that localized information to extrapolate the whole picture. It’s a bit like sampling a forest not by counting every tree, but by counting trees in a few representative patches and then scaling up with a measured error bar.
What makes this especially compelling is not just the speed—though the math pays off in time saved—but the idea that you can decide ex-ante how aggressively you probe a sample. That means, before you start the heavy-duty chemical imaging, you have a principled estimate of how many regions you need to scan to get trustworthy totals for particles and microplastics. The study’s authors are explicit that this approach is designed for the real world: environmental samples are messy, their particles are unevenly distributed, and the goal is to deliver reliable data without locking researchers into days of labor. The work also demonstrates that the method is robust across two major platforms for particle deployment: reflective Kevley slides and gold-coated polymeric filters, both standard workhorses in microplastic monitoring.
The authors frame this as a paradigm shift in how we approach large-scale microplastics monitoring. Instead of committing to a fixed fraction of the plate or filter, you measure enough slices to bound the error, then report the median estimate across the best-performing slices. The result is a practical, data-driven compromise: substantial reductions in analysis time (often 40–50%) with accuracy that, in many typical size ranges (like 50–20 µm and 100–50 µm), remains well within acceptable uncertainty for environmental monitoring.
In laying out the method, López-Rosales and colleagues also address a crucial reality: not all samples behave the same way. Some samples are dense with particles, others are sparse; some polymers appear more often, others vanish in a given slice. The paper doesn’t pretend to be a one-size-fits-all recipe. Instead, it offers a dynamic approach: after a quick preliminary pass that counts all particles in a given target size range, the team determines which set of subregions will yield the smallest extrapolation error. Those chosen regions become the full-coverage zones where every particle is characterized to identify the polymers and, if relevant, to distinguish fibers from fragments. The rest of the sample remains scanned only as needed to reach the broader goals of the study. The result is a workflow that is both flexible and auditable, with error estimates that can be computed ex-ante rather than after the fact.
Why a smarter sampling method matters
Think of a reflective plate or a gold-coated filter as a canvas. When you pour a treated environmental sample onto it, particles settle in unpredictable clumps and sparse islands. Before this study, subsampling strategies often relied on fixed patterns or random windows that could miss pockets of microplastics or over-represent clusters. The new approach flips that script: you first map what you’ve got, then tailor the subregions to what you actually see. It’s a bit like a photographer adjusting focal regions after scanning a landscape for the first time—the exposure is tuned to what’s in front of the lens rather than what you assumed would be there.
The practical upshot is twofold. First, the method makes large-scale monitoring more feasible by dramatically reducing the number of particles that must be fully analyzed. Second, it preserves representativeness by ensuring that the areas chosen for exhaustive analysis reflect the actual spatial distribution of particles across the plate. In other words, you don’t gamble with a pre-set pattern; you gamble with a pattern that the sample itself reveals. The paper demonstrates that, for many environmental matrices, this approach keeps errors in the single-digit to low-tens percentile for total particle counts and stays under 20% for microplastics, even as it processes thousands of items at a time.
As with any scientific advance, there are caveats. The authors show that when particles are rare—one or two items in a given size or polymer class—the extrapolation can over- or under-estimate as a function of which slices get counted. They also note that blanks, which often contain few particles, are not ideal candidates for subsampling, since the sparse distribution can distort estimates. And they acknowledge that disaggregating results by both size and polymer introduces added complexity when distributions are especially sparse, such as for fibers in certain samples. Still, the broad message is hopeful: for the majority of typical environmental samples, you can scale up from a carefully chosen subset of regions to a faithful portrait of the whole, with fewer hands on the keyboard and fewer hours at the microscope.
What this means for the future of microplastics monitoring
The study’s platform-agnostic logic matters because microplastics research often runs against a policy-driven clock. Governments and agencies demand timely, comparable data to guide cleanup efforts, evaluate risk, and track improvements or deteriorations over time. By showing that a 40% sampling plan can achieve reliable estimates across multiple matrices and particle classes, the authors offer a practical recipe for scalable monitoring. It’s the difference between a lab that can process a few hundred samples a year and one that can realistically tackle thousands across a monitoring campaign, city by city or coast by coast.
Another layer of significance is methodological: the approach could harmonize how labs across the world collect data. If multiple groups adopt a similar sample-based decision logic, we could see tighter inter-lab comparability for not just particle counts, but also microplastics by polymer type and by size. That matters for regulatory benchmarks, risk assessments, and the broader scientific dialogue about where microplastics come from, how they travel, and who or what is most affected by their presence. The University of A Coruña team frames their contribution as a bridge between the speed needed for large-scale monitoring and the accuracy required for meaningful interpretation. It’s not a flashy gadget so much as a smarter way to couple data, optics, and statistical thinking into a workflow that fits the real world.
For researchers, practitioners, and policymakers listening for signals in noisy data, this work is a reminder that getting to the answer fast doesn’t have to mean guessing. When you let the data guide where you look first, you can quantify your own uncertainty, calibrate your confidence, and still move quickly enough to inform timely interventions. The authors are frank about limits—sparse distributions, big particles, and highly uneven polymer representation will still challenge any subsampling scheme—but their results suggest a practical, widely deployable path forward. It’s the kind of incremental advance that, in aggregate across the field, could dramatically increase our ability to map, manage, and mitigate microplastic pollution as it unfolds across ecosystems.
In the end, the study’s core idea is deceptively simple: measure enough representative slices to know the total, then trust the math to fill in the rest. The people behind it come from the University of A Coruña, where Adrián López-Rosales and his team are turning a quantum-cascade laser into a practical microscope for the planet’s most pervasive pollutant. If you’ve ever wondered how scientists can keep pace with a problem as unwieldy as microplastics, this work offers a concrete answer rooted in a blend of clever engineering, careful statistics, and a willingness to tune the instrument to the contours of each sample. It’s not about counting every particle; it’s about knowing when you’ve counted enough to know the rest, with confidence, speed, and humility.
Institution and leadership note: The research was conducted by the Group of Applied Analytical Chemistry at the Institute of Environmental Sciences (IUMA) of the University of A Coruña in Spain, led by Adrián López-Rosales, with collaborators José M. Andrade, Borja Ferreiro, and Soledad Muniategui-Lorenzo.


