


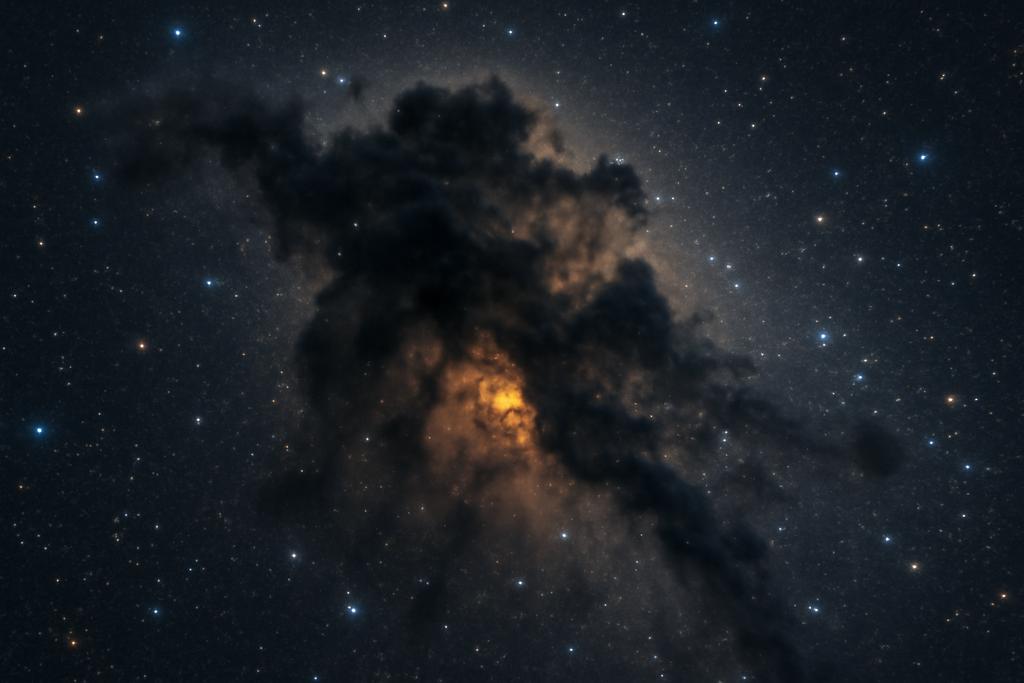
Dust in space isn’t just a nuisance for stargazing; it shapes everything we see. It dims and reddens starlight, hides newborn suns, and challenges astronomers who try to read the cosmic forest of gas and dust. The story of how that dimming works—its wavelength dependence, its variations from cloud to cloud—is a fingerprint of the tiny grains that fill the Milky Way and a reminder that the universe is a lab for materials science on the scale of cities.
In a study led by the Center for Astrophysics at Guangzhou University, researchers tested a classic method for measuring dust extinction by counting stars. They focused on Corona Australis, a nearby star forming cloud, and used deep near infrared data from the VISIONS survey to build detailed maps of how much light is blocked in the J, H, and KS bands. The work, by Botao Jiang, Jun Li, and Xi Chen, asks not just how much light is blocked, but what that blocking can tell us about the dust itself and how stable that dust recipe is across wavelengths. The answer, for now, is a careful yes with caveats—tantalizing clues that the dust is behaving in a way that aligns with broader Galactic patterns, even in a place where stars are actively sculpting their surroundings.
A map made from starlight
The Wolf method, named after its originator, uses the fact that starlight dimming with extinction makes faint background stars disappear. In practice, the region is divided into a grid and the counts of stars in each cell are compared to a nearby reference field assumed to be unaffected by the cloud. Where there are fewer stars than expected, the difference maps to extinction in that band. The method is elegant in its simplicity, but it relies on careful statistics and a steady backdrop of background stars to count against.
To quantify the relationship correctly, the researchers pulled a robust sample from VISIONS, a deep VISTA survey covering the CrA region in J, H, and KS bands. They built extinction maps at a modest 1 arcminute pixel scale, smoothing with a 2 arcminute kernel to suppress noise while preserving structure. They then calibrated the method by analyzing ten reference fields, finding remarkably consistent stellar-density slopes across bands: bJ = bH = 0.31 mag^-1 and bKS = 0.32 mag^-1 across the magnitude range where the method is most reliable. The total uncertainty in these slopes, when folded into the final extinction estimates, is about 0.014 per band, a small but real contribution to the error budget.
With those ingredients, the team produced AJ, AH, and AKS maps. The results show the full cloud reaches AJ up to 6.8 mag, AH up to 4.1 mag, and AKS up to 2.7 mag. In the densest pockets, AJ saturates earlier than AKS, a reminder that shorter-wavelength light is more easily blocked, and that measuring extinction there is trickier. Yet the maps come with a typical uncertainty around 0.4–0.5 mag in each band, a testament to how much information you can squeeze from a region a few tenths of a parsec across when you push to the depth of modern surveys.
These maps don’t just produce neat color pictures. They encode the density structure of the cloud, revealing filaments and dense cores that are the cradles of future stars. And they do so at a scale of roughly 0.05–0.1 parsecs, a level of detail that lets astronomers connect dust physics to the messy, dynamic reality of star formation. Stellar densities unlock dust fingerprints, and the Wolf method makes that fingerprint readable even in regions where the night sky feels overwhelming.
A surprisingly tidy law in a messy frontier
One of the central questions in interstellar science is how extinction—how much light is blocked by dust—changes with wavelength. In the near-infrared, a common assumption is a power-law form Aλ ∝ λ−α, where α captures how steeply the dust dims light as you move from J to H to KS bands. The team used their measured extinction ratios between bands to deduce α for CrA, and the result is strikingly consistent across the three pairings: αJH = 2.01 ± 0.09, αHKS = 1.98 ± 0.14, and αJKS = 2.05 ± 0.07. Averaging, α ≈ 2.0, with no statistically significant difference between the JH and HKS combinations. In plain terms: the CrA cloud behaves like a textbook dust in the near-infrared, at least as far as these bands can see.
The derived extinction ratios—AJ/AH = 1.73 ± 0.07, AH/AKS = 1.70 ± 0.11, and AJ/AKS = 3.02 ± 0.22—are compatible with the broad Galactic literature. They fall within a standard deviation of the literature means, which is a neat cross-check: the star-count method, when fed by modern deep data, recovers the crowd-sourced consensus about dust in the Milky Way. The work also probes subregions within CrA, designated CrA-A, CrA-B, and CrA-C. Those subregions show hints of variation: CrA-A and CrA-C tend toward the lower end of the ratios, while CrA-B edges higher. But the authors are careful about drawing firm conclusions; the apparent differences could be subtle artifacts of depth, reference-field choices, or completeness limits rather than clean physical differences in dust grains. The message is clear: the dust law is robust on average, with whispers of local differences worth chasing with sharper eyes.
To connect the observed ratios to physical grain properties, the researchers compared their results with simple dust models. If the grains in dense pockets grow—by coagulation or ice mantle formation—one would expect the extinction ratios to drop as grains become larger or more efficient at absorbing long-wavelength light. The figures show that, in model families that include ice mantles or larger maximum grain sizes, the predicted ratios can shift in the direction suggested by the CrA maps. That said, the authors emphasize these as exploratory comparisons rather than definitive evidence of grain growth. The uncertainty bars are wide enough that a robust claim would require deeper data and careful control of biases. The idea that the dust life story might be read in the light dimmed by it is tantalizing, but not yet a closed chapter.
In other words, the CrA results walk a fine line between “this is how dust commonly behaves” and “this cloud is a laboratory for dust evolution.” The measured α near 2.0 places CrA in the middle of the historical spread, not at one extreme, reminding us that the universe often lands in a statistical middle ground rather than a dramatic outlier. It also adds a practical takeaway: when astronomers map stellar populations through CrA or similar clouds, assuming a single power-law extinction with α around 2.0 may be a solid baseline, at least in the current observational window. The researchers themselves couch the spatial variations as tantalizing hints, not a final verdict, a sign that future work could refine our view of how dust evolves in the densest corners of star formation.
What this means for peering through cosmic dust
Beyond the satisfaction of measuring a dust law that matches the wider Galaxy, the study has a practical ripple effect for how we map the cosmos. Extinction maps are the backbone of estimates of cloud mass, star formation rates, and the distribution of gas that feeds newborn stars. If the NIR extinction law is stable and well-behaved, astronomers can convert faint starlight into robust, quantitative pictures of a cloud’s interior. That’s not a glamorous revelation, but it is a crucial one for anyone trying to translate a star-forming cloud into a census of future suns.
The work also demonstrates the value and limits of the Wolf method in modern data sets. The approach is elegant in its simplicity: count how many stars you expect to see behind a patch of sky and compare that with what you observe. But it is fragile where observations push into the realm of high extinction with few background stars left to count, and where the choice of a reference field can tilt results. The CrA study shows that with careful calibration—using many reference fields, accounting for their uncertainties, and cross-checking against independent extinction measures—Wolf can yield results that align with more complex, model-based methods. In other words, a relatively old trick still has teeth when wielded with high-quality data.
What makes the findings especially intriguing is the possibility that extinction fingerprints could reveal something about the dust’s life story. The hints of regional variation in CrA’s extinction ratios, coupled with the theoretical idea that ice mantles and grain growth shift light in predictable ways, point to a cosmos in which dust grains are not static trophies but evolving actors shaped by local conditions. Dense cores, radiation from newborn stars, and shocks from outflows could all nudge grains toward different sizes and structures. If confirmed, those variations would provide a rare observational handle on dust evolution stages within a single cloud, letting astronomers connect microphysics to the macro-structure of star-forming regions.
The Corona Australis study also underscores the importance of future observations. A space telescope with infrared prowess, like the James Webb Space Telescope, could push completeness in the densest regions even further and help disentangle photometric biases from real physical changes. The researchers themselves note that their tentative spatial trends require more robust measurements to move from tantalizing hints to solid conclusions. Still, the path forward is clear: deeper data, more careful references, and a broader sky to test whether dust follows universal rules or tells a more nuanced, local story.
In short, this work from Guangzhou University offers a disciplined reminder that the cosmos still rewards patience and careful counting. It is a reminder that even something as familiar as dust can teach us new things about how the universe hides its secrets in plain sight, if we only know where to look and how to count what we see.


