


At the quiet frontier where scanned equations meet artificial brains, the hard problems hide in the margins. A stray symbol, a faded bracket, or a tiny subscript can derail a whole line of reasoning. Modern vision-language models can transcribe math from images, but their confidence is usually published as a single score for the entire page. That coarse signal misses a deeper truth: some places in a transcription are more fragile than others, and those fragile pockets are the places most likely to produce real mistakes.
Researchers at Wilfrid Laurier University in Canada, led by Alexei Kaltchenko, asked: what if we could turn the model’s own hesitation into a map you can follow? They call it entropy heat-mapping—a lightweight technique that takes the per-token probabilities the model returns and translates them into an uncertainty landscape over the transcript. As you slide a window along the sequence, you expose hotspots where the model seems unsure, offering editors a compass for post-editing. It’s a little like weather predicting for pixels of text: the goal is not perfection on every token, but knowing where to look first when a transcription looks dicey.
What the heatmap reveals
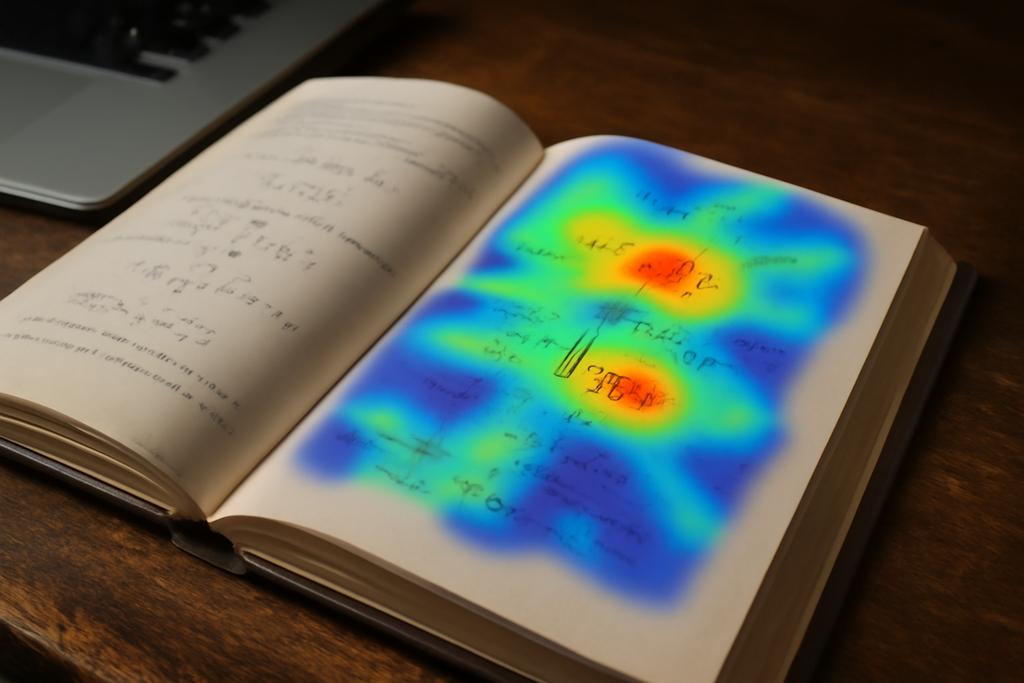
At its heart, the idea borrows from information theory. For every position in the transcript, the model isn’t just producing one guess; it assigns probabilities to a handful of candidate tokens. The spread of those probabilities is the token-level entropy: if one token dominates, the entropy is low; if the mass is spread, entropy is high. In plain terms: the more the model hedges, the more uncertain it is about what should appear next. The heatmap translates that hedging into color, with the red zones marking where the model’s inner weather is stormy.
To keep things practical when you only see the top few guesses (the API often returns top-k probabilities plus a catch-all tail), the researchers use a truncated entropy: they compute the entropy of the k shown tokens and lump the rest into a single tail bucket. This yields a lower bound on the true entropy but is remarkably effective at flagging trouble spots. The result is a per-token uncertainty score that can be treated like a weather map: green for calm, red for storms. The method is intentionally lightweight, because the goal is a practical signal people can act on without a full-blown probabilistic reconstruction of every possible token.
Next, you don’t want to stare at a single token in isolation. The team slides a fixed-length window along the transcript and averages the entropy inside each window. The mean entropy Ah captures whether a chunk of tokens tends to be dense with doubt. High-entropy windows—hotspots—are the candidates editors should peek at first. It’s a simple trick with a big payoff: you focus human effort where it matters most. In the words of the paper, you’re turning a long wall of characters into a handful of danger zones you can trust to guide review and correction.
From concept to a tiny experiment in math OCR
To test the idea, the team assembled a tiny, carefully controlled proof-of-concept corpus. Twelve scanned pages from arXiv papers were rendered at three resolutions—72, 150, and 300 dots per inch—producing 36 image instances. The goal wasn’t to beat a benchmark but to see whether the hotspots align with real mistakes in GPT-based transcription of mathematics. In this context, the errors aren’t just squiggles; they are misread symbols, misplaced braces, and missing subscripts that can completely change an equation’s meaning.
The pipeline is deliberately lean. They extract the transcript with an API like GPT-4o that returns the top-k token probabilities, then compute the per-token truncated entropies. Next comes the sliding window: a length of ten tokens strikes a balance between isolating individual symbol glitches and catching short subexpressions that share a common source of confusion. For each page, they identify the top three hotspots—the windows where the mean entropy Ai is highest—and visually annotate the final LaTeX transcript with color. The entire process runs in linear time with respect to the number of tokens, making it plausible to scale to thousands of pages with modest compute, especially if you batch pages together.
Three human experts then compared the highlighted hotspots against the actual errors in the transcripts. They found that most transcription mistakes—ranging from a misread Greek letter to a missing underscore for a subscript or mismatched braces—fell inside those high-entropy regions. In other words, the heatmap was doing more than mousing around in the model’s head: it was pointing to real trouble zones that editors would want to recheck or re-prompt. The alignment wasn’t perfect, but it was consistently close enough to feel actionable. And in the context of digitizing dense math, where one symbol can flip the meaning of a sentence, that proximity matters a lot.
Beyond the results, the authors emphasize openness: all code, sample images, and annotation guidelines are publicly available at a GitHub repo. They argue the approach is a useful, low-overhead addition to digitization pipelines where speed and reliability matter. In practical terms, you could imagine a library ingesting thousands of scanned pages, tagging hotspots, and then routing them to human proofreaders or to automated re-prompt steps that target just the flagged segments. The method is designed to be a plug-in rather than a full replacement for existing OCR workflows.
Why this could change how we digitize science
Right now, large-scale digitization projects—think libraries, journals, and preprint repositories—face a tug-of-war between speed and accuracy. Full line-by-line proofreading is expensive, and even the best OCR stacks can miss tiny but consequential details in math notation. The entropy-heatmap idea gives you a practical third way: you don’t have to reprint everything; you just re-check the hotspots. The authors estimate a dramatic improvement in proofreading efficiency because editors can focus on a small fraction of the text that carries the bulk of possible errors. That’s the kind of leverage you want when every page is a piece of a larger knowledge puzzle that people will rely on for years to come.
More broadly, this is part of a longer trend: turning the raw probabilities that power AI systems into usable signals for humans. The local entropy map is a lightweight, interpretable cue that sits between “the model is confident” and “the whole document is suspect.” It’s the kind of tool that could be integrated into post-processing steps, auto-correct loops, and even real-time editing workflows. Think of it as a check-engine light for mathematical transcription rather than a full diagnostic overhaul. The beauty is in its simplicity: a handful of numbers, a simple window, and suddenly you have a navigator for a dense sea of symbols.
Of course, the study isn’t a silver bullet. It relies on a small, proof-of-concept dataset, and hotspot confidence can be noisy. Some high-entropy windows may not contain actual errors, signaling a need for better thresholds or smarter follow-ups, like targeted re-prompts or context-aware corrections. Yet the direction is compelling: with a tiny bit of math and a little taste for uncertainty, we can make AI-assisted OCR more reliable and more transparent. The authors acknowledge that false alarms exist—places where the model trembles but still gets the symbol right—and that is exactly the kind of signal a future system could refine with adaptive thresholds or hybrid human-machine checks.
Looking forward, the authors propose several extensions: adaptive windowing that responds to the structure of mathematics, automated re-prompting for the flagged segments, and expansion to other multimodal tasks—handwritten math, historical documents, multilingual pages, and multi-column layouts. The same sliding-window entropy idea could help researchers and librarians tame the flood of scanned materials, giving readers a clearer, more trustworthy path from image to equation. If you’ve ever tried to OCR a page with dense formulas, you’ll recognize the value of a method that respects the algebraic rhythm of notation while quietly surfacing the exact spots where rhythm goes off beat.
In short, the study offers a practical bridge between raw AI uncertainty and real-world editing workflows. It does not pretend to solve every OCR problem, but it does equip humans with a map that makes the error-prone terrain legible. And because the map is built from data the model already generates—per-token probabilities—it sits naturally inside existing AI-assisted transcription pipelines, rather than forcing a wholesale redesign of how we read math on machines.
Finally, the work is anchored in a concrete institution and person: Wilfrid Laurier University in Canada, with Alexei Kaltchenko as the lead author. The project highlights a savvy mix of theory and pragmatism: a theorem-like guarantee (a lower bound on entropy when you compress tail probabilities) paired with a tangible, screen-and-edit workflow. And the authors don’t just publish ideas; they publish code and guidelines to help others reproduce and extend their results, inviting the community to refine the method and apply it to broader digitization challenges.
As the volume of scanned literature only grows, tools like entropy heat-mapping are likely to become part of the default toolkit for anyone who wants to trust the math they read on a screen. It’s not the final answer to OCR, but it’s a smart, human-friendly step toward transparency, reliability, and speed in the long archival project of turning images into accessible knowledge.


