


Rising flood risk isn’t just about rainstorms; it’s also about patterns. Where water piles up, where it drifts, and how cities, rails, and rivers braid together in a landscape. The French Riviera has become a testing ground for turning those patterns into practical maps that help protect people and infrastructure. In a study led by researchers at Université Paris-Saclay (including CentraleSupélec, ENS Paris-Saclay, and CNRS’s LMPS) the team tests a new kind of computer model that treats flood risk like a social network—only with rivers, hills, and roads as its neighbors. The paper’s authors are Vemula Sreenath, Filippo Gatti, and Pierre Jehel, and they push a single idea forward: graph transformers can read the topology of a watershed as a connected web, not as a bag of separate variables. The aim is simple in principle but ambitious in practice—build a high-resolution map that says, with measurable confidence, which places are most likely to flood now and how that risk might shift under climate change.
Floods aren’t distant events in some abstract dataset. They’re real-time interactions between rainfall, terrain, soils, drainage networks, and human landscapes. The Riviera has endured dramatic floods in recent decades—the Var, Paillon, and Siagne basins have memories of storms that reshaped coastlines and towns. The study uses a rich blend of data: digital elevation models, river channels, land cover, soils, precipitation histories, and even land-use projections for 2050. The question is whether a graph-based method can do more than mimic traditional models: can it actually sharpen the edges of risk boundaries—where one area ends and another begins in terms of flood susceptibility—and can it still adapt to changing climates and landscapes? The answer, as the team shows, is yes, with caveats.
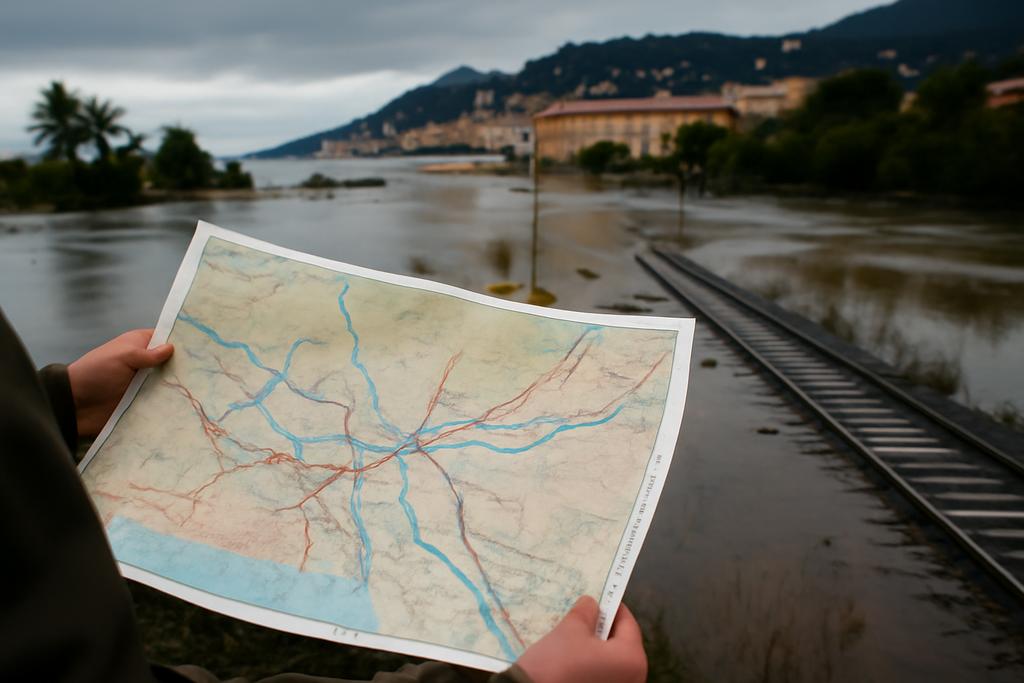
What really matters here is not just a single accuracy score, but a holistic picture: how well a model clusters flood-prone zones, how clearly it draws boundaries between risk levels, and how it behaves when you force it to think about future climates. The Riviera study is also a blueprint for thinking about infrastructure—rail tracks alongside the coast, vulnerable to rapid waterlogging when storms strike. The authors root their work in the tangible, pointing to Storm Alex in 2020 and to the concrete need to protect critical arteries of transport. In short, the research isn’t only about maps; it’s about maps that can inform decisions today and tomorrow for the ships, trains, and towns that share a coastline with water.


